Observability & Monitoring
Tracking what your agents are doing with hooks, logs, and real-time dashboards
What you'll learn
Why Observability Matters
Running a multi-agent team without observability is like managing a remote engineering team with no Slack, no standups, and no issue tracker. Work might be happening—but you have no idea whether it's the right work, how far along it is, or whether someone has been blocked for the last forty minutes.
Observability transforms agent teams from black boxes into transparent, manageable systems. When something goes wrong—and it will—good observability is the difference between a five-minute diagnosis and a thirty-minute guessing game. When everything goes right, it gives you the confidence to let agents run longer and tackle more complex problems.
The Three-Layer Observability Stack
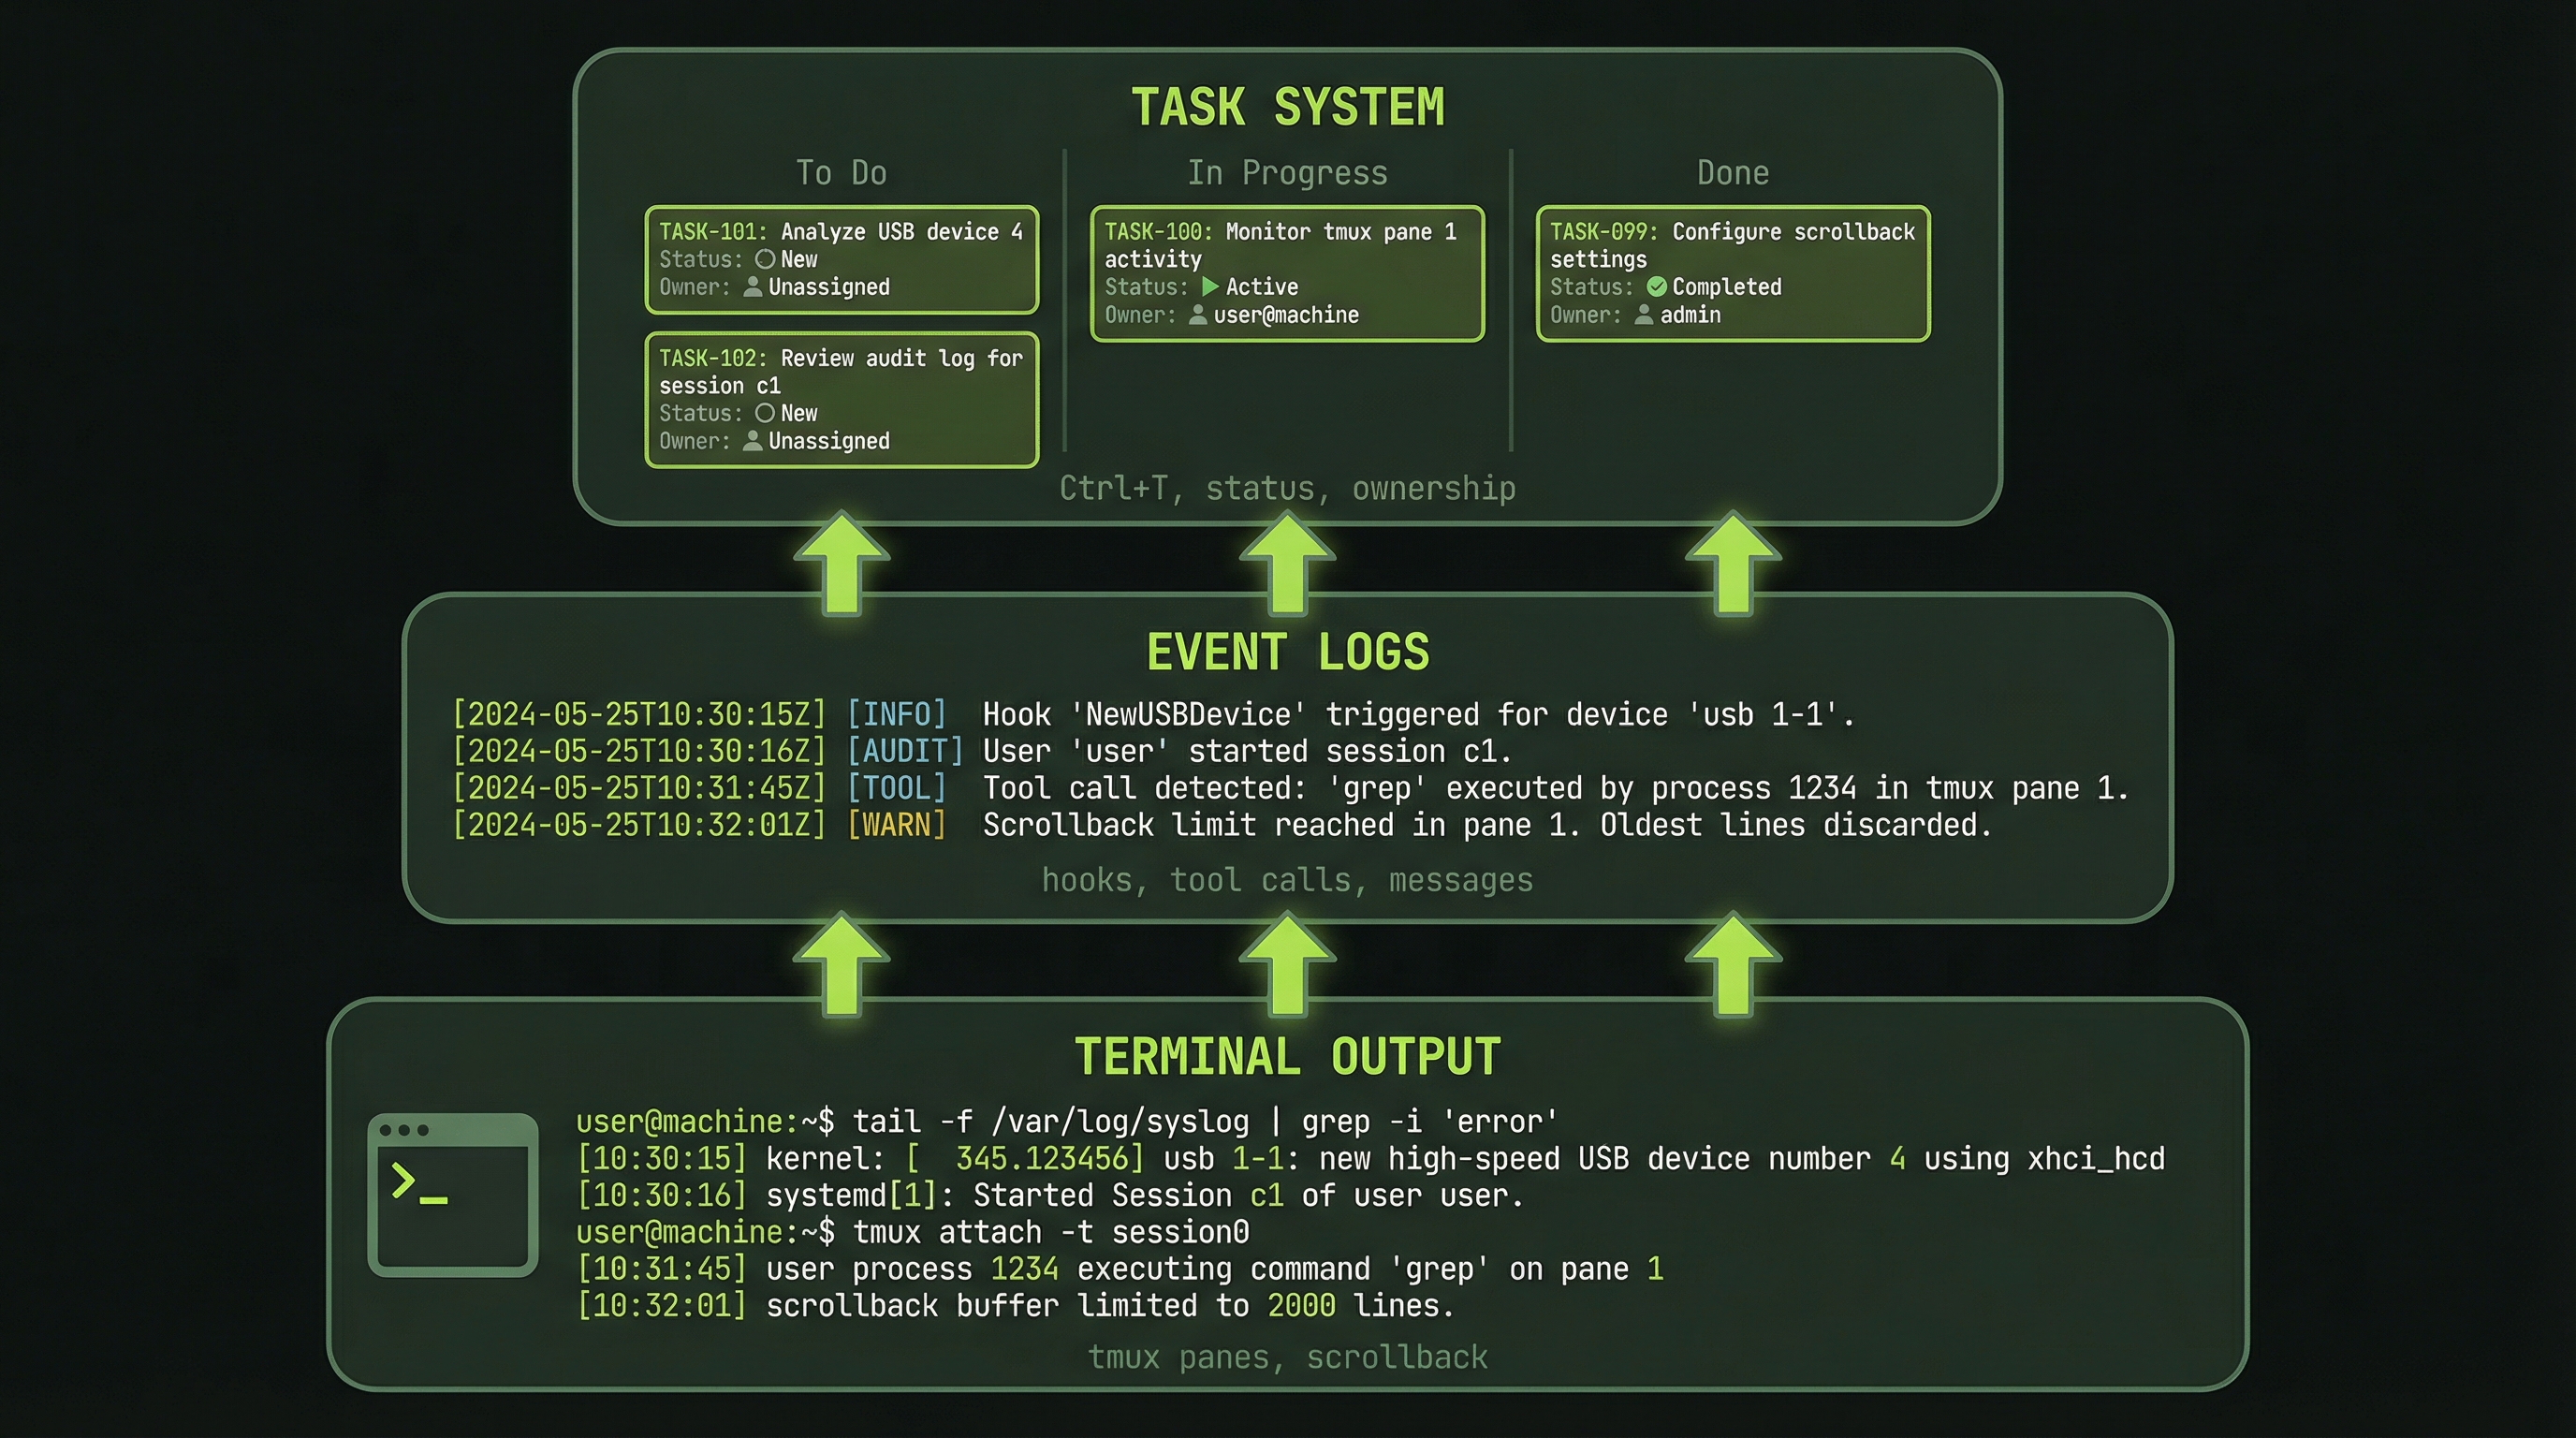
Agent team visibility operates at three distinct layers, each giving you different information at different levels of detail.
LAYER 1: Terminal Output (tmux)
├─ Agent pane output (raw logs)
├─ Status lines (context %, model, elapsed time)
└─ Visible in real-time as work happens

LAYER 2: Agent Event Logs
├─ Tool calls (what agents are actually doing)
├─ Message sends (inter-agent communication)
├─ Task updates (progress state changes)
├─ Searchable and filterable after the fact
└─ Accessible via Claude Code logs

LAYER 3: Task System
├─ Task list (what's assigned to whom)
├─ Task status (pending / in-progress / complete)
├─ Completion timestamps
├─ Execution history and handoff records
└─ Queryable via TaskList tool from the lead
Think of Layer 1 as your real-time heartbeat monitor—it tells you that agents are alive and doing something. Layer 2 is your audit trail—it records exactly what happened and when. Layer 3 is your project board—it shows the big picture of whether work is moving forward.
Effective monitoring uses all three layers together. You glance at Layer 1 to confirm activity, query Layer 3 to understand progress, and dive into Layer 2 when something needs investigation.
Navigating the tmux Pane Layout
When agents spawn in tmux, each gets its own pane. The visual layout itself is a form of observability—you can see at a glance which panes are active (scrolling output) and which are idle (static text).
┌─────────────────────┬──────────────────────┐
│  LEAD AGENT (left)  │  TEAMMATE 1 (right)  │
│                     │                      │
│ "Creating team..."  │ [Waiting to spawn]   │
│ "Task list created" │                      │
│ "Spawning agent 1"  │ ┌────────────────┐   │
│ "Spawning agent 2"  │ │ Teammate 1     │   │
│ "Team ready"        │ │ claude-opus-4.6│   │
│                     │ │ 32% context    │   │
│ [Monitoring]        │ │ Claiming task 1│   │
│                     │ └────────────────┘   │
└─────────────────────┴──────────────────────┘
The status line at the bottom of each pane is your most immediate health signal. It shows the model name, current context percentage, and elapsed time. A pane whose context is climbing steadily is working. A pane that has been at exactly the same percentage for several minutes may be stuck.
Key Signals to Watch For
Train yourself to recognize these patterns in agent output:
✓ "Claiming task #N"       → Agent starting a new work unit
✓ "Task completed"         → Agent finished and ready for next
✓ "Sending message to X"   → Inter-agent communication happening
✗ "Error: ..."             → Problem that needs your attention
✗ No output for 2+ minutes → Agent may be stuck or waitingAn agent pane that produces no output for more than two minutes is your first warning sign. It may be waiting on a tool response, blocked on a dependency, or stuck in a reasoning loop. Switch to that pane and ask it directly: "What are you currently working on?"
Scrolling Through Pane History
tmux keeps a scrollback buffer for each pane, giving you access to the full history of what an agent has done even after the visible output has scrolled past. This is invaluable for post-hoc debugging.
Ctrl+B [          # Enter scroll mode
[Arrow Up]        # Scroll up one line at a time
[Arrow Down]      # Scroll down one line at a time
[Page Up]         # Jump up a full screen
[Page Down]       # Jump down a full screen
q                 # Exit scroll mode, return to live output
When you enter scroll mode, tmux freezes the live output so you can read without the screen updating underneath you. Once you press q, you return to the live feed. The buffer size is configurable in your ~/.tmux.conf—for agent work, setting it to at least 5000 lines is recommended.
Checking Task Status During Execution
The task system is your project management layer. At any point during a team run, you can ask the lead agent for a structured status report without disrupting the agents' work.
"What's on the task list right now?"

Lead reports:
Task #1: ✓ COMPLETED (SecurityReviewer)
  "Review authentication module"
  Completed in 3 minutes

Task #2: 🔄 IN PROGRESS (PerformanceReviewer)
  "Identify performance bottlenecks"
  Started 2 min ago

Task #3: ⏳ PENDING (TestReviewer)
  "Analyze test coverage"
  Independent — can start now

Task #4: 🔄 IN PROGRESS (PerformanceReviewer)
  "Suggest optimization fixes"
  Started 1 min ago
Notice that Task #3 is pending and independent of Task #2. If the TestReviewer has been idle, this is your signal to prompt the lead to assign it. The task system gives you the visibility to make these interventions without guessing.
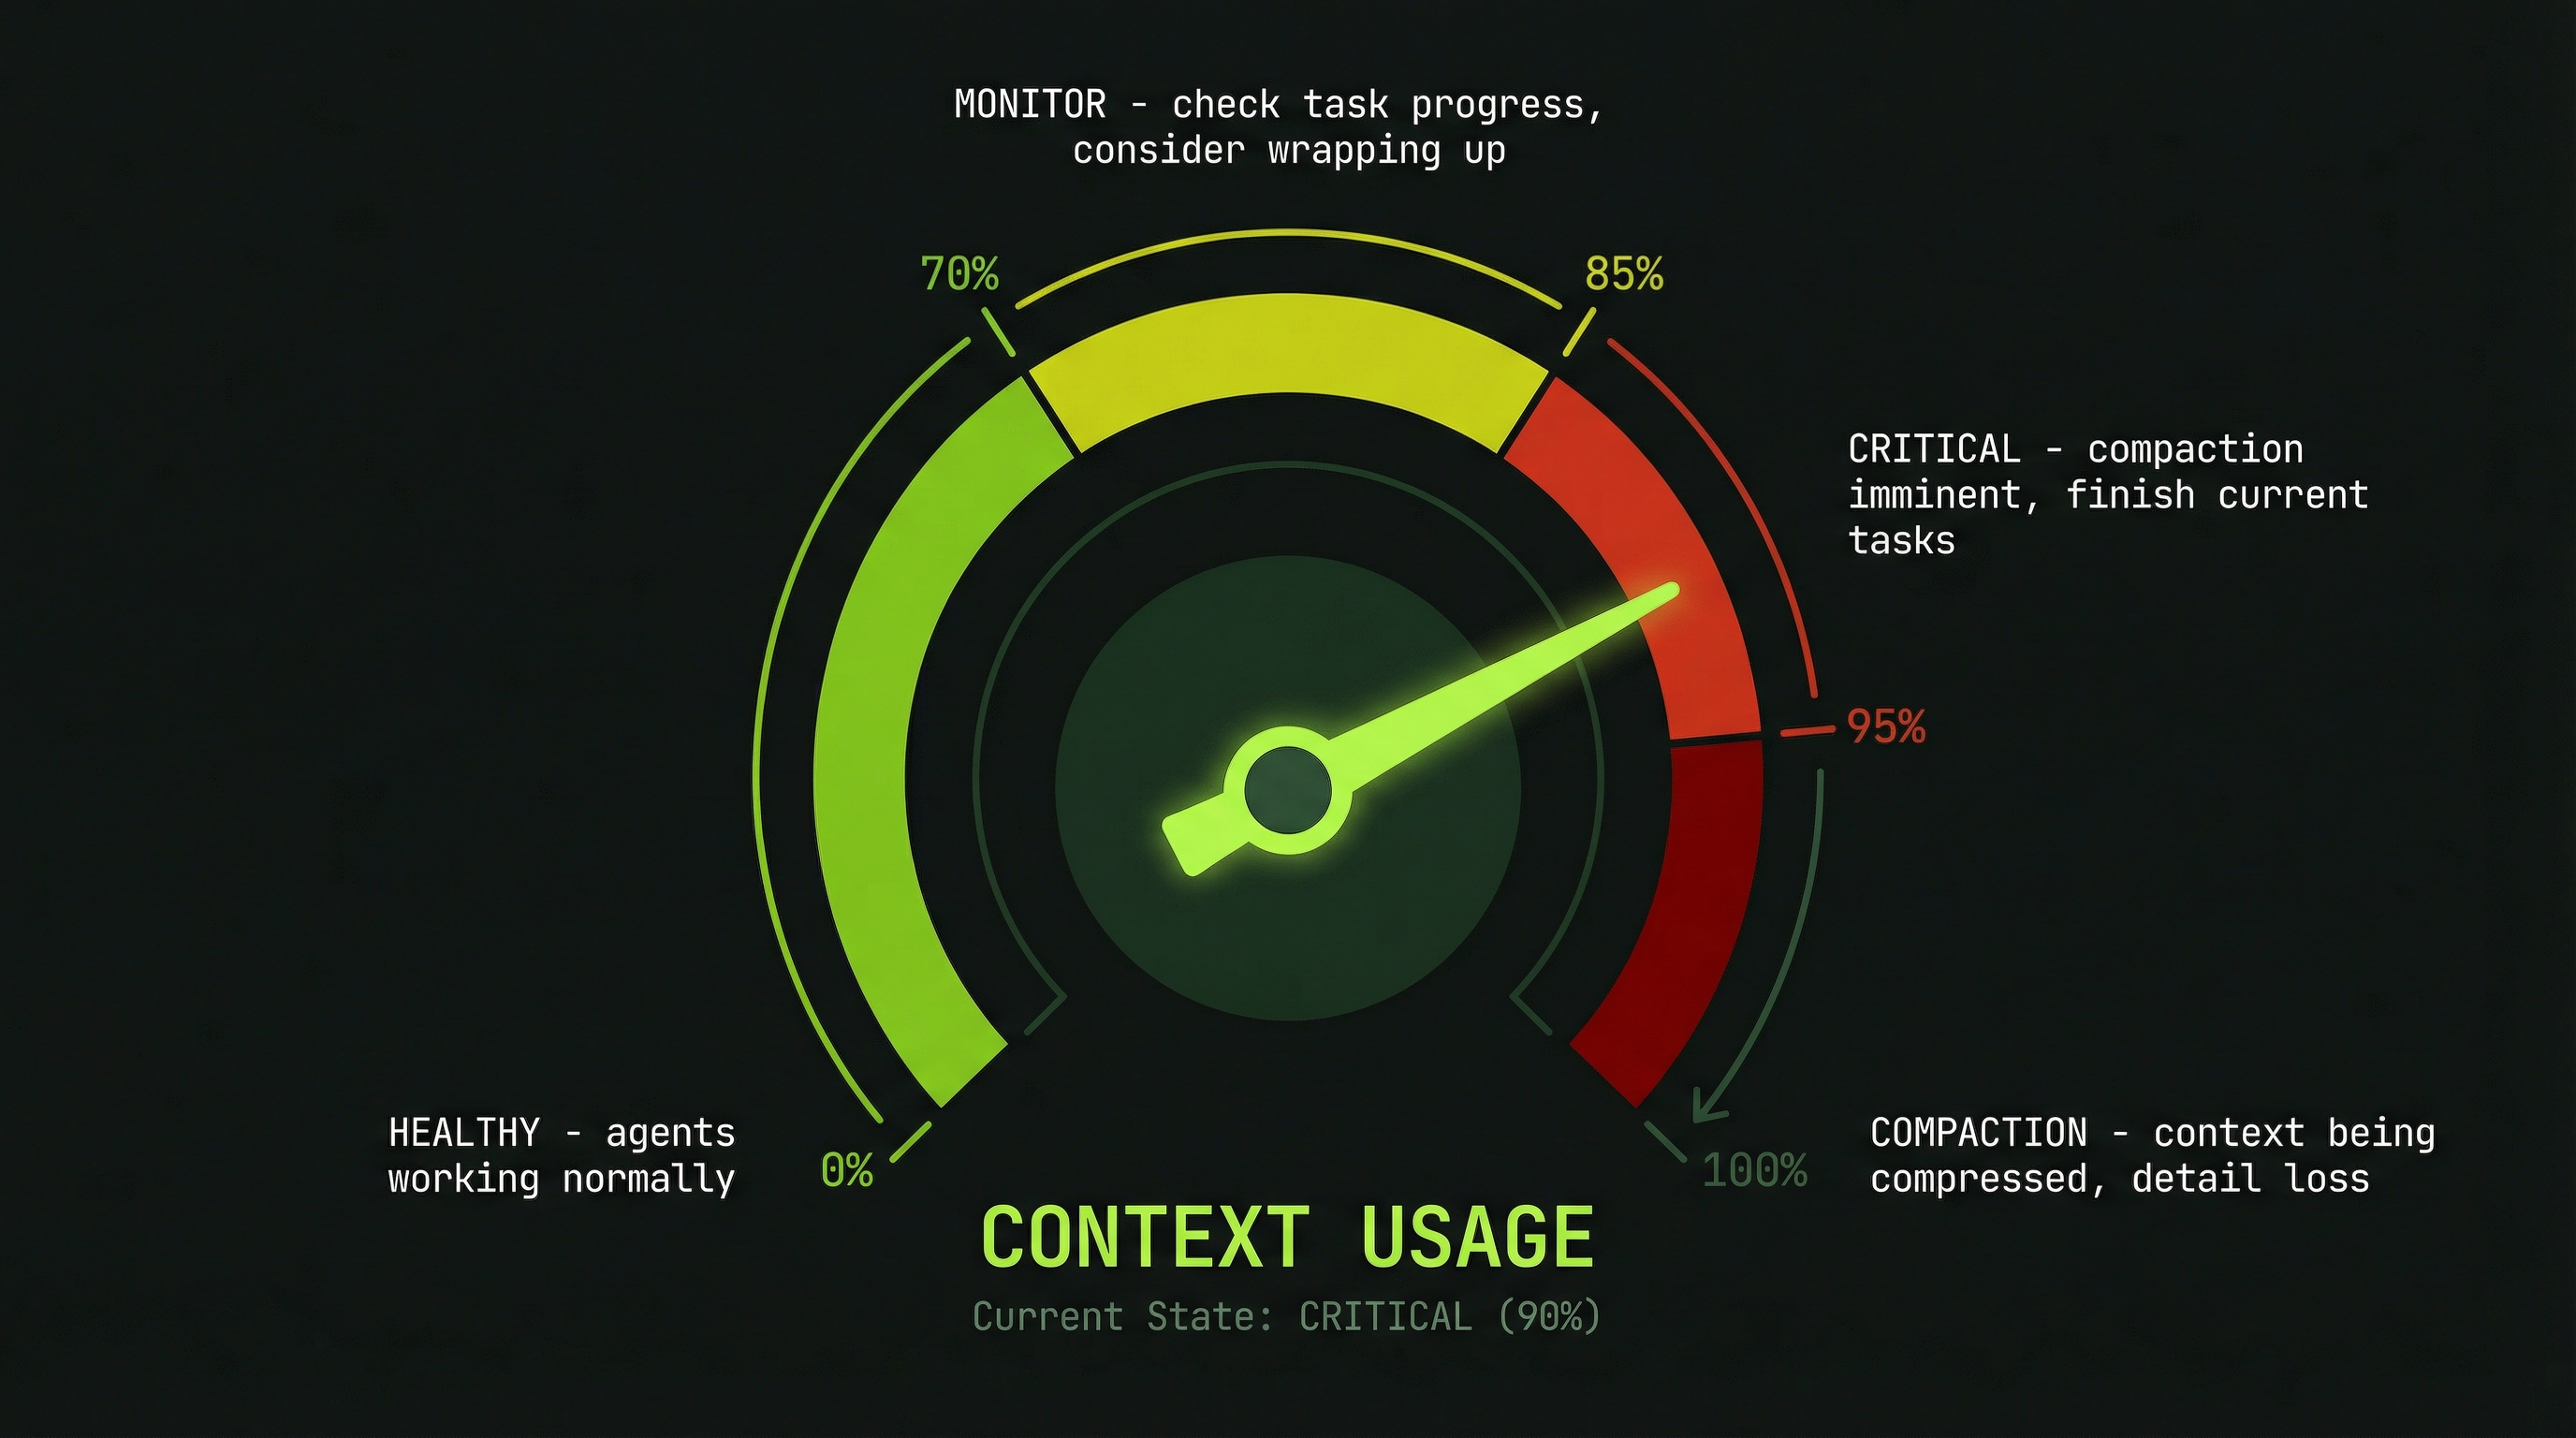
Monitoring Context Usage
Context percentage is one of the most important metrics for long-running agent teams. Each agent has a finite context window, and as it fills up, the agent's performance degrades before it eventually triggers automatic compaction—which can silently discard earlier context that may contain critical information.
Backend Agent     42%   ← healthy
Frontend Agent    51%   ← healthy
Database Agent    29%   ← plenty of room
Here are the thresholds to keep in mind:
- Under 70%: No action needed. Agent is operating normally.
- 70–80%: Start watching closely. Consider breaking the current task into smaller steps.
- 85–90%: Intervene now. Have the agent summarize its work and commit what it has.
- Over 95%: Auto-compact triggers or already happening. The agent may lose context from earlier in the session.
When an agent approaches the limit, the right intervention is a graceful handoff, not a hard stop:
# Message to a high-context agent:
"You're at 80% context. Please:
1. Summarize all work completed so far
2. Commit any uncommitted changes
3. List any remaining open items
4. Prepare for handoff"

# Then start a fresh agent with the summary as context
Reading Tool Call Logs
Claude Code logs every tool call made by every agent. This is your forensic record—it tells you not just what an agent said, but what it actually did. The distinction matters: an agent might report "I updated the payments endpoint" while the logs show it read the file but never wrote it.
[14:23:05] Agent: Backend
Tool Call: read_file("src/api/payments.ts")
Tool Call: write_file("src/api/payments.ts")
  Added: POST /api/payment/process endpoint
  Tests: 5/5 passing
Tool Call: send_message(to: "Frontend")
  "API ready — endpoint is POST /api/payment/process"
Tool call logs answer questions like: Did the agent actually write the file, or just read it? Did the message get sent to the right recipient? How many tool calls did this task require—was it efficient or did the agent spin in circles?
Tracing Inter-Agent Messages
One of the most powerful debugging techniques is message tracing—searching the logs for all SendMessage calls to reconstruct the communication history between agents.
[14:24:12] Database → Backend:
  "Schema defined: users table with token_balance INT"

[14:25:03] Backend → Frontend:
  "API ready: POST /api/payment/process
   Expects: { package_id: string, quantity: int }
   Returns: { success: bool, token_balance: int }"

[14:26:15] Frontend → Backend:
  "Implementing UI. Quick question: should quantity default to 1?"

[14:26:22] Backend → Frontend:
  "Yes, default to 1. Can override in request body."
This trace shows a healthy communication pattern: contracts are being sent on completion, and agents are resolving ambiguities through targeted questions rather than making silent assumptions. If you see large gaps in the message log, agents may be working on incorrect assumptions about each other's interfaces.
Debugging Communication Failures
When a team goes quiet or progress stalls, a systematic four-step diagnostic process will identify the cause in under two minutes.
Step 1: Check if messages are being sent
  → Search logs for "SendMessage"
  → If none: agents are not communicating

Step 2: Check task dependencies
  → Ask lead for current task assignments
  → Is someone waiting on a blocked dependency?

Step 3: Inspect the stuck agent's pane
  → Ctrl+B + arrow to navigate to the pane
  → Scroll through recent output
  → Look for error messages or tool timeouts

Step 4: Direct interrogation
  → Switch to the agent's pane
  → Type: "What are you currently working on?"
→ The agent's answer will reveal the blockageYou can always switch to an agent's pane and talk to it directly. The agent will respond as if you were its primary operator. Use this to unblock agents that are waiting on information, correct misunderstandings, or redirect work without going through the lead.
Token Consumption Monitoring
Understanding token spend in real time lets you make informed decisions about whether to continue, restructure, or spin down a team early. Token costs accumulate quickly across multiple agents, so visibility is essential for staying within budget.
"How many tokens have we used so far?"

Lead reports:
Phase 1 (Planning):   5,000 tokens
Backend Agent:       12,450 tokens
Frontend Agent:      11,200 tokens
Database Agent:       8,930 tokens
─────────────────────────────────
TOTAL SO FAR:        37,580 tokens  (~$0.75)
Estimate to finish:  +15,000 tokens (~$0.30)
Projected total:     52,580 tokens  (~$1.05)
Compare the projected total against the value of the work being done. If you're at 80% of your token budget and 40% through the work, you need to either restructure the remaining tasks or spin down and continue with a fresh team.
Configuring Observability Hooks
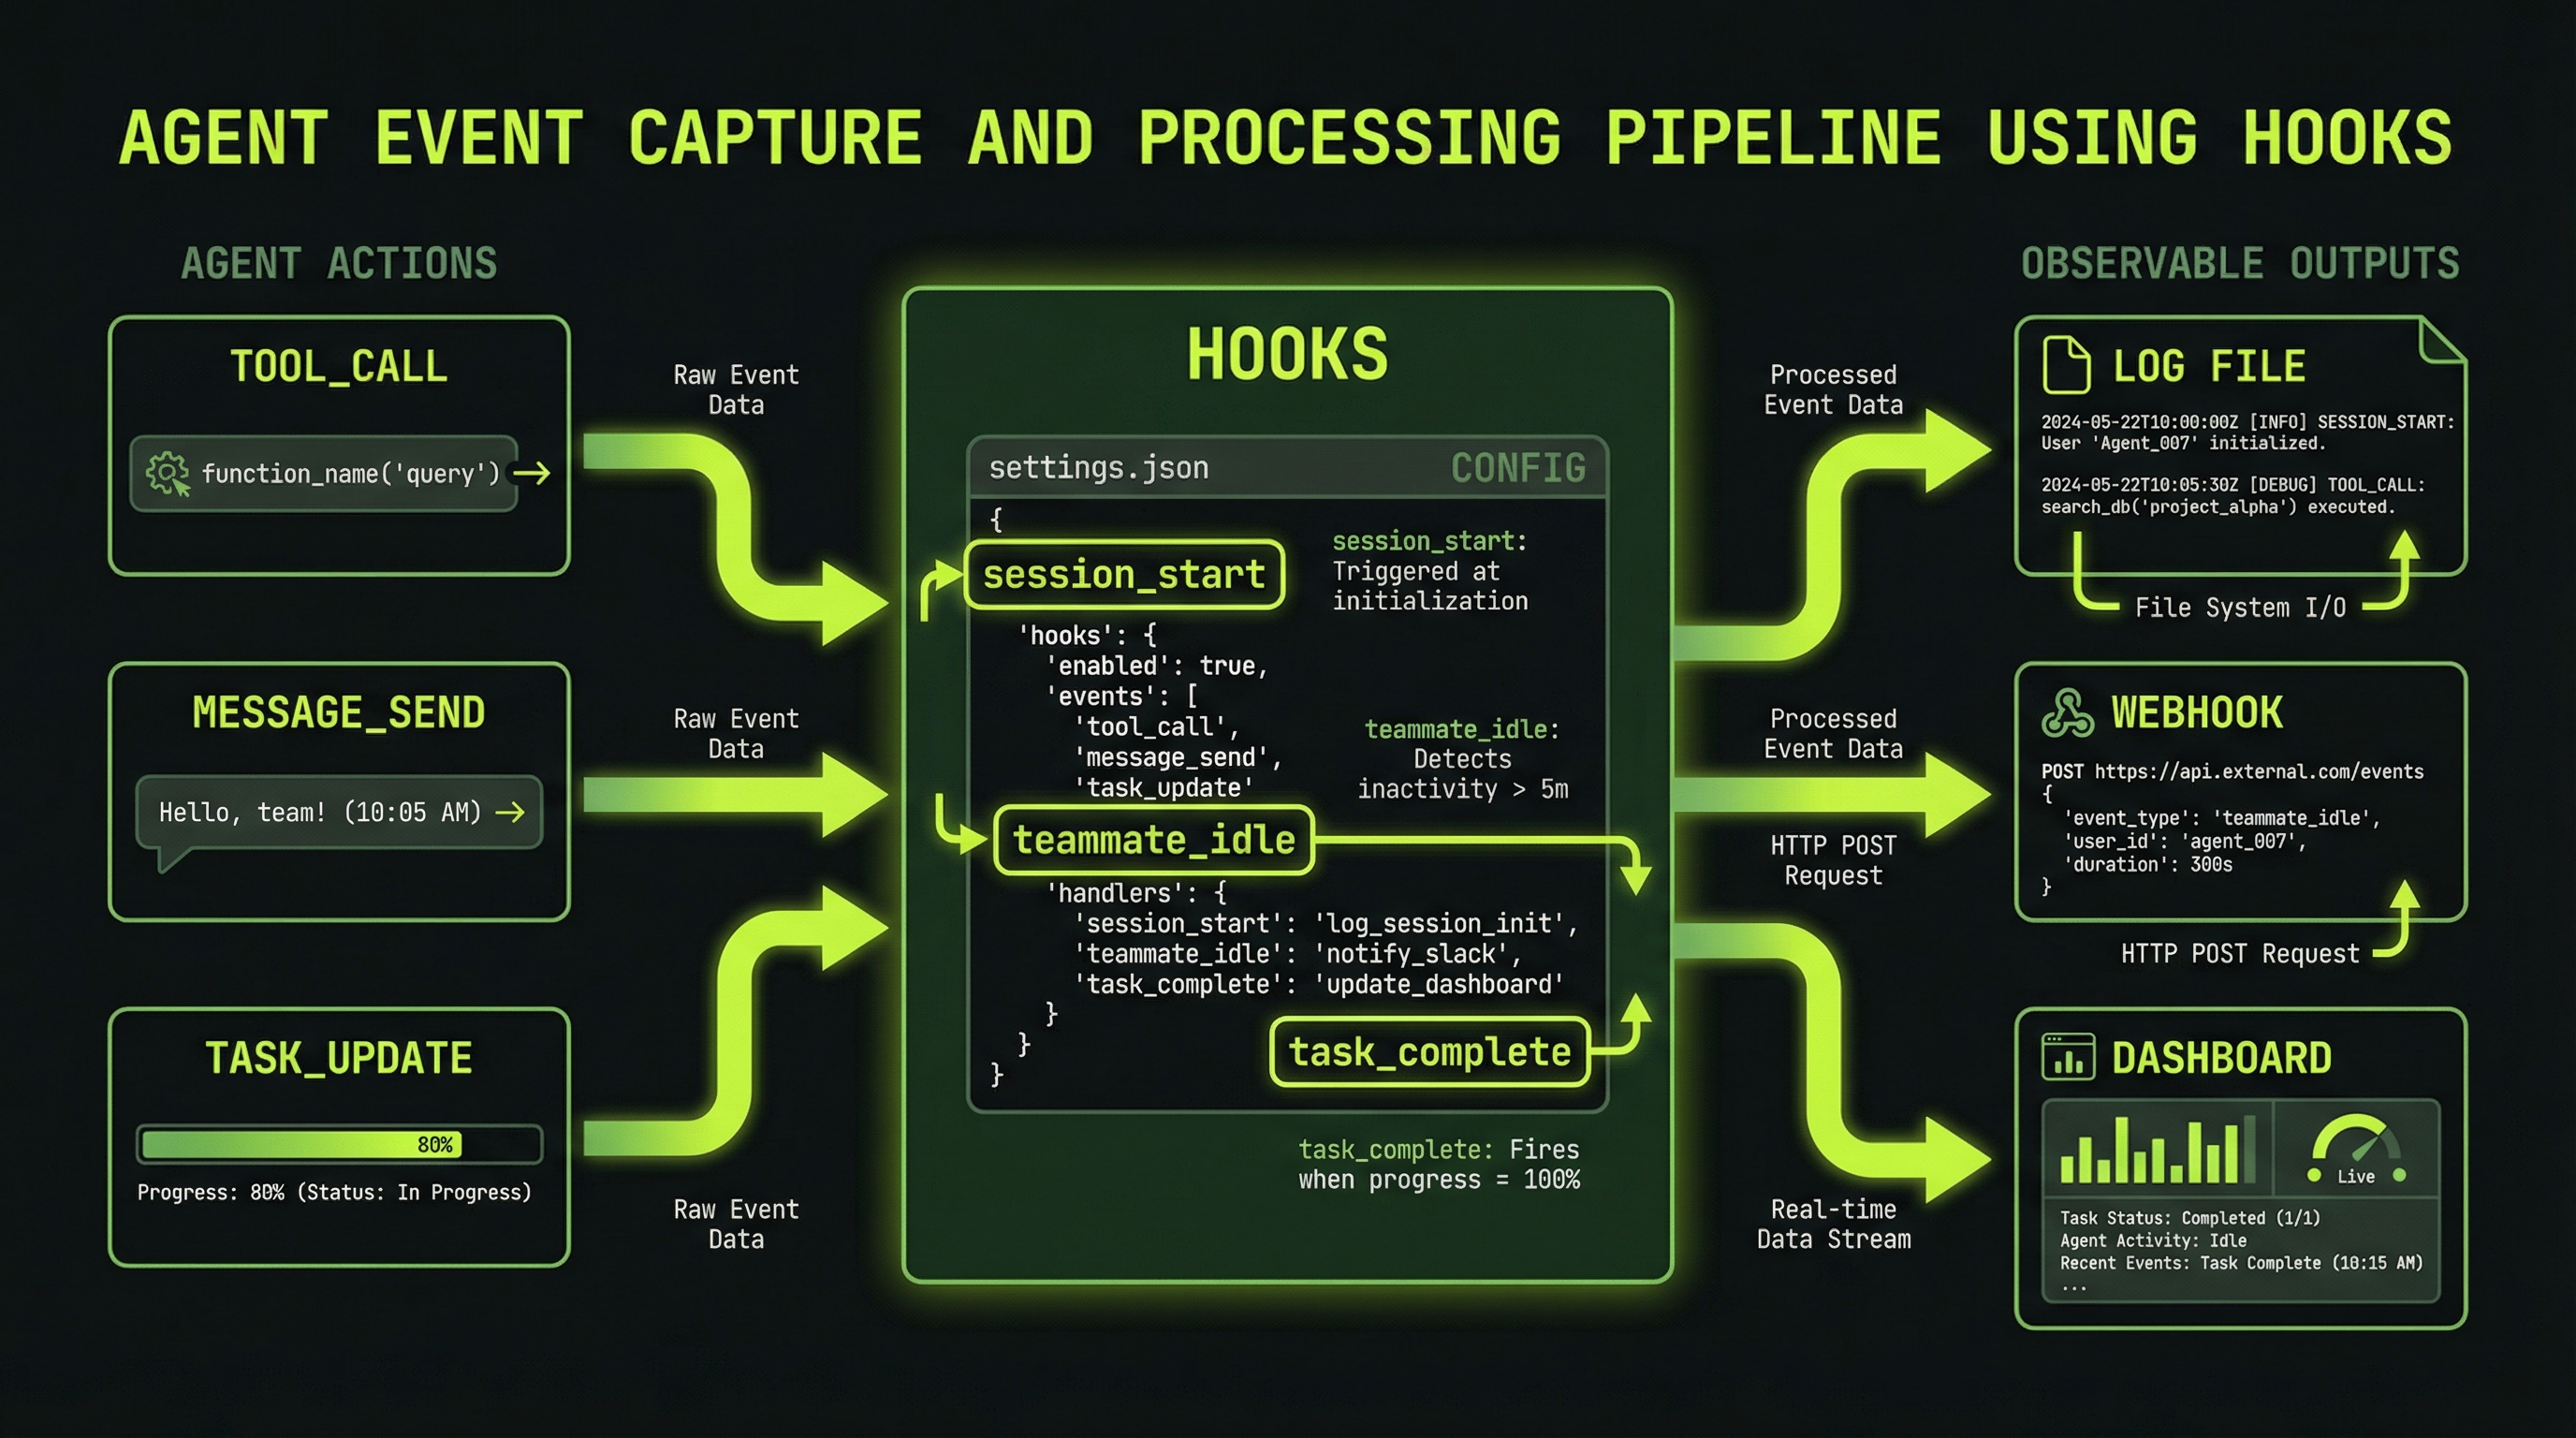
Claude Code supports hooks in settings.json that trigger shell commands on lifecycle events. Hook events include PreToolUse, PostToolUse, Notification, and others. You can use these to build custom monitoring for agent teams.
{
  "hooks": {
    "Notification": [
      {
        "matcher": "",
        "hooks": [
          {
            "type": "command",
            "command": "echo \"$(date): $CLAUDE_NOTIFICATION\" >> ~/agent-events.log"
          }
        ]
      }
    ],
    "PostToolUse": [
      {
        "matcher": "Task",
        "hooks": [
          {
            "type": "command",
            "command": "echo \"Task tool used\" >> ~/agent-events.log"
          }
        ]
      }
    ]
  }
}Agent teams also support SubagentStart, SubagentStop, and TeammateIdle events for hooks. Use Ctrl+T inside Claude Code to view the current task list and monitor agent progress directly.
The Notification hook is particularly useful for long-running teams — pipe it to a desktop notification tool like terminal-notifier on macOS so you get alerted when agents complete work without watching the terminal continuously.
The Two-Minute Dashboard Pattern
For teams running longer than ten minutes, establish a regular check-in cadence. Every two minutes, ask the lead for a structured status snapshot:
"Give me a dashboard summary:
- Tasks done / in-progress / pending
- Each agent's context usage (%)
- Any errors or blockers
- Estimated minutes to completion"
This pattern does two things: it gives you the situational awareness to intervene early if needed, and it prompts the lead agent to actively synthesize status from its teammates, which itself surfaces any communication gaps that might otherwise go unnoticed.
Setting Up Proactive Alerts
Rather than polling every two minutes, you can instruct the lead to monitor specific conditions and alert you proactively. This lets you focus on other work while the team runs:
"Monitor the team and alert me if any of these occur:
- Any agent hits 80% context warning
- Any agent produces no output for 3 minutes
- A task fails and gets reassigned
- Any error appears in the logs

Also give me a two-minute warning before shutdown."
The lead will continue coordinating the team while watching for these conditions. When a threshold is hit, it will interrupt to notify you—the equivalent of an on-call alert for your agent infrastructure.
The most effective multi-agent practitioners develop a rhythm: spawn the team, set up proactive alerts, and check in every few minutes for the first ten minutes to establish that the team is executing correctly. After that, let the alerts do the work. This balance of active watching and trusting the system is what separates practitioners who get great results from those who babysit every token.
Ctrl+B [) to review an agent's history and identify where it got stuck